Modal Split
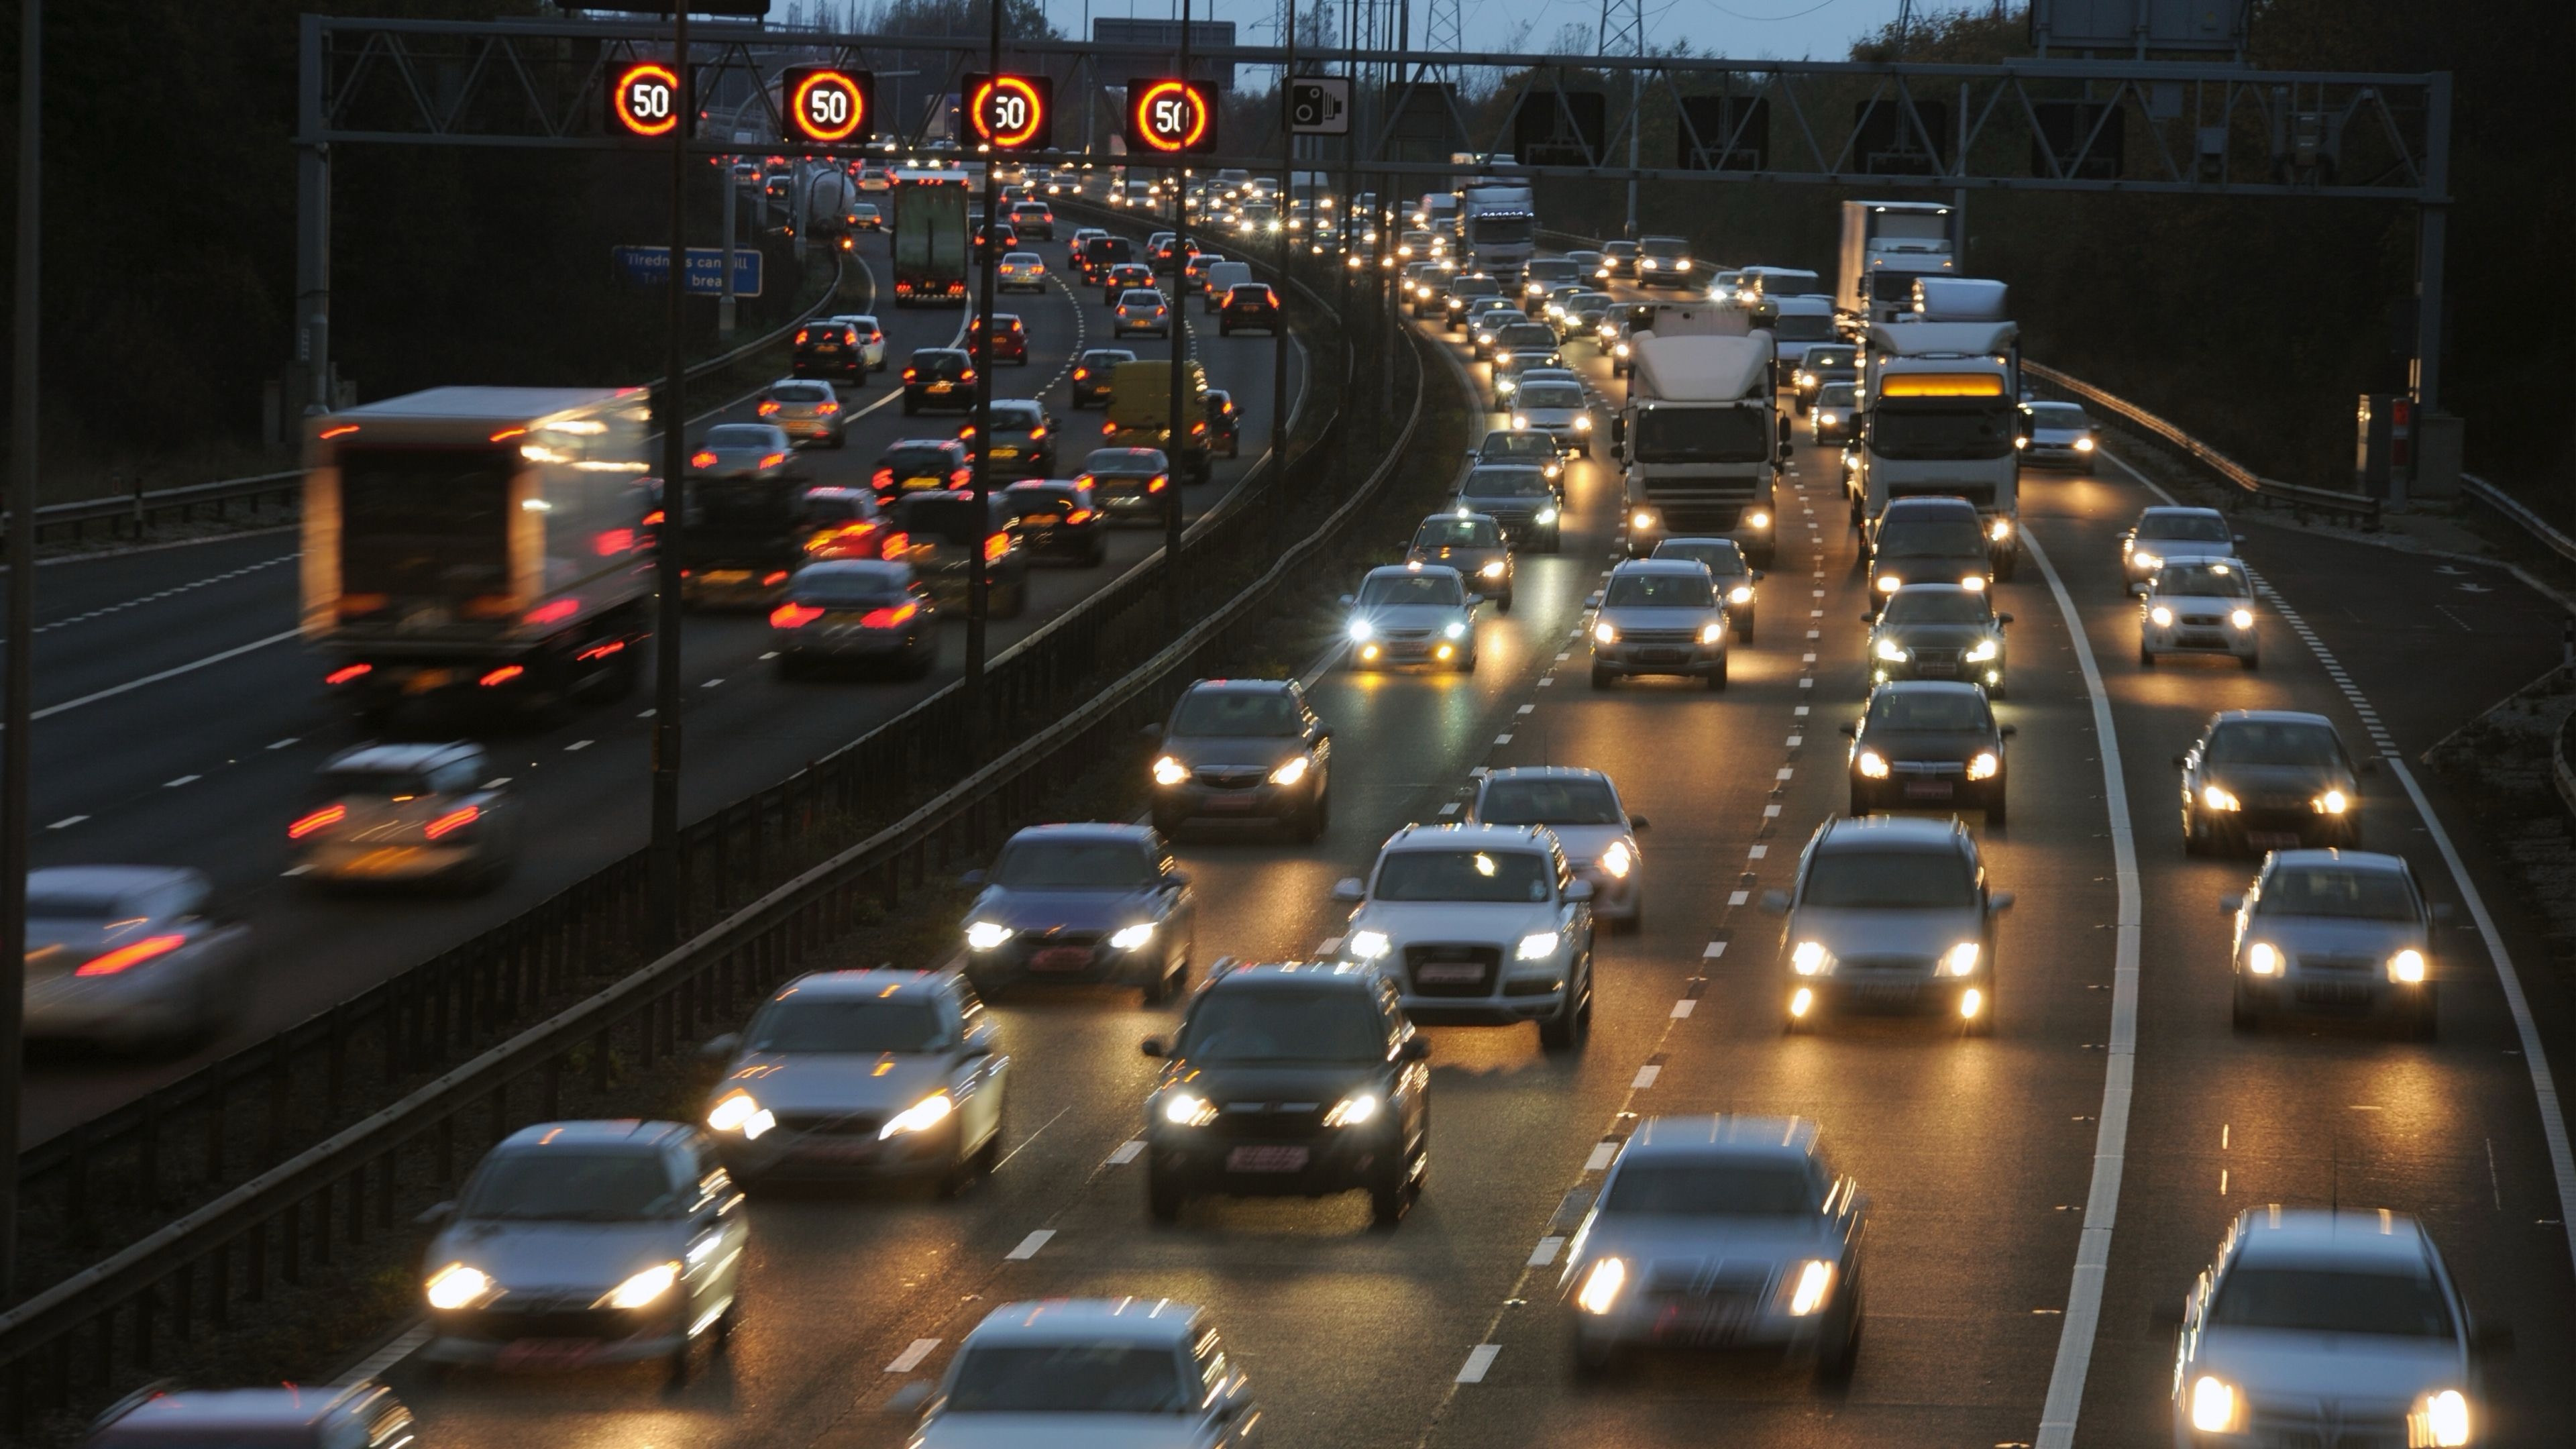
Insight into transport modes
Modal split provides insight into how visitors travel to and from the event. The various modes of transport, such as pedestrians, cyclists, cars, public transport, and taxis, can be measured either collectively or individually. This reveals how mobility patterns evolve around the site and identifies where peaks in arrival and departure occur.
Request product sheet
After your submission, we will sent you the solution white paper via email
Real-time management of mobility and accessibility
Measurements are carried out using vision technology via CCTV cameras, with data aggregated in real time on the Event Dashboard. This enables targeted management of accessibility and traffic flow during the event and provides post-event insights into transport choices and trends. These insights can serve as a basis for evaluation, mobility policy, and sustainability objectives, among other things.

Waarom deze oplossing
Real-time insights
Real-time insight into visitor numbers, density, and flow.
High precision
Measurements with at least 98% accuracy.
One dashboard
All data consolidated into a single Central Event Dashboard.
Analyze transport flows and arrival patterns.
Vergelijkbare oplossingen
Traffic study
Safe and manageable surroundings for the event

Parking lots
Gaining control over parking pressure and policy

Event Dashboard
All data in one place
It provides insight into traffic levels on access routes and in parking areas, allowing traffic to be redirected.
Yes, traffic sensors are showing increasing congestion. As a result, traffic can be diverted.
No, license plate registration is not used. The system counts the vehicles anonymously.