Sport Events

Monitoring and coordination along the route
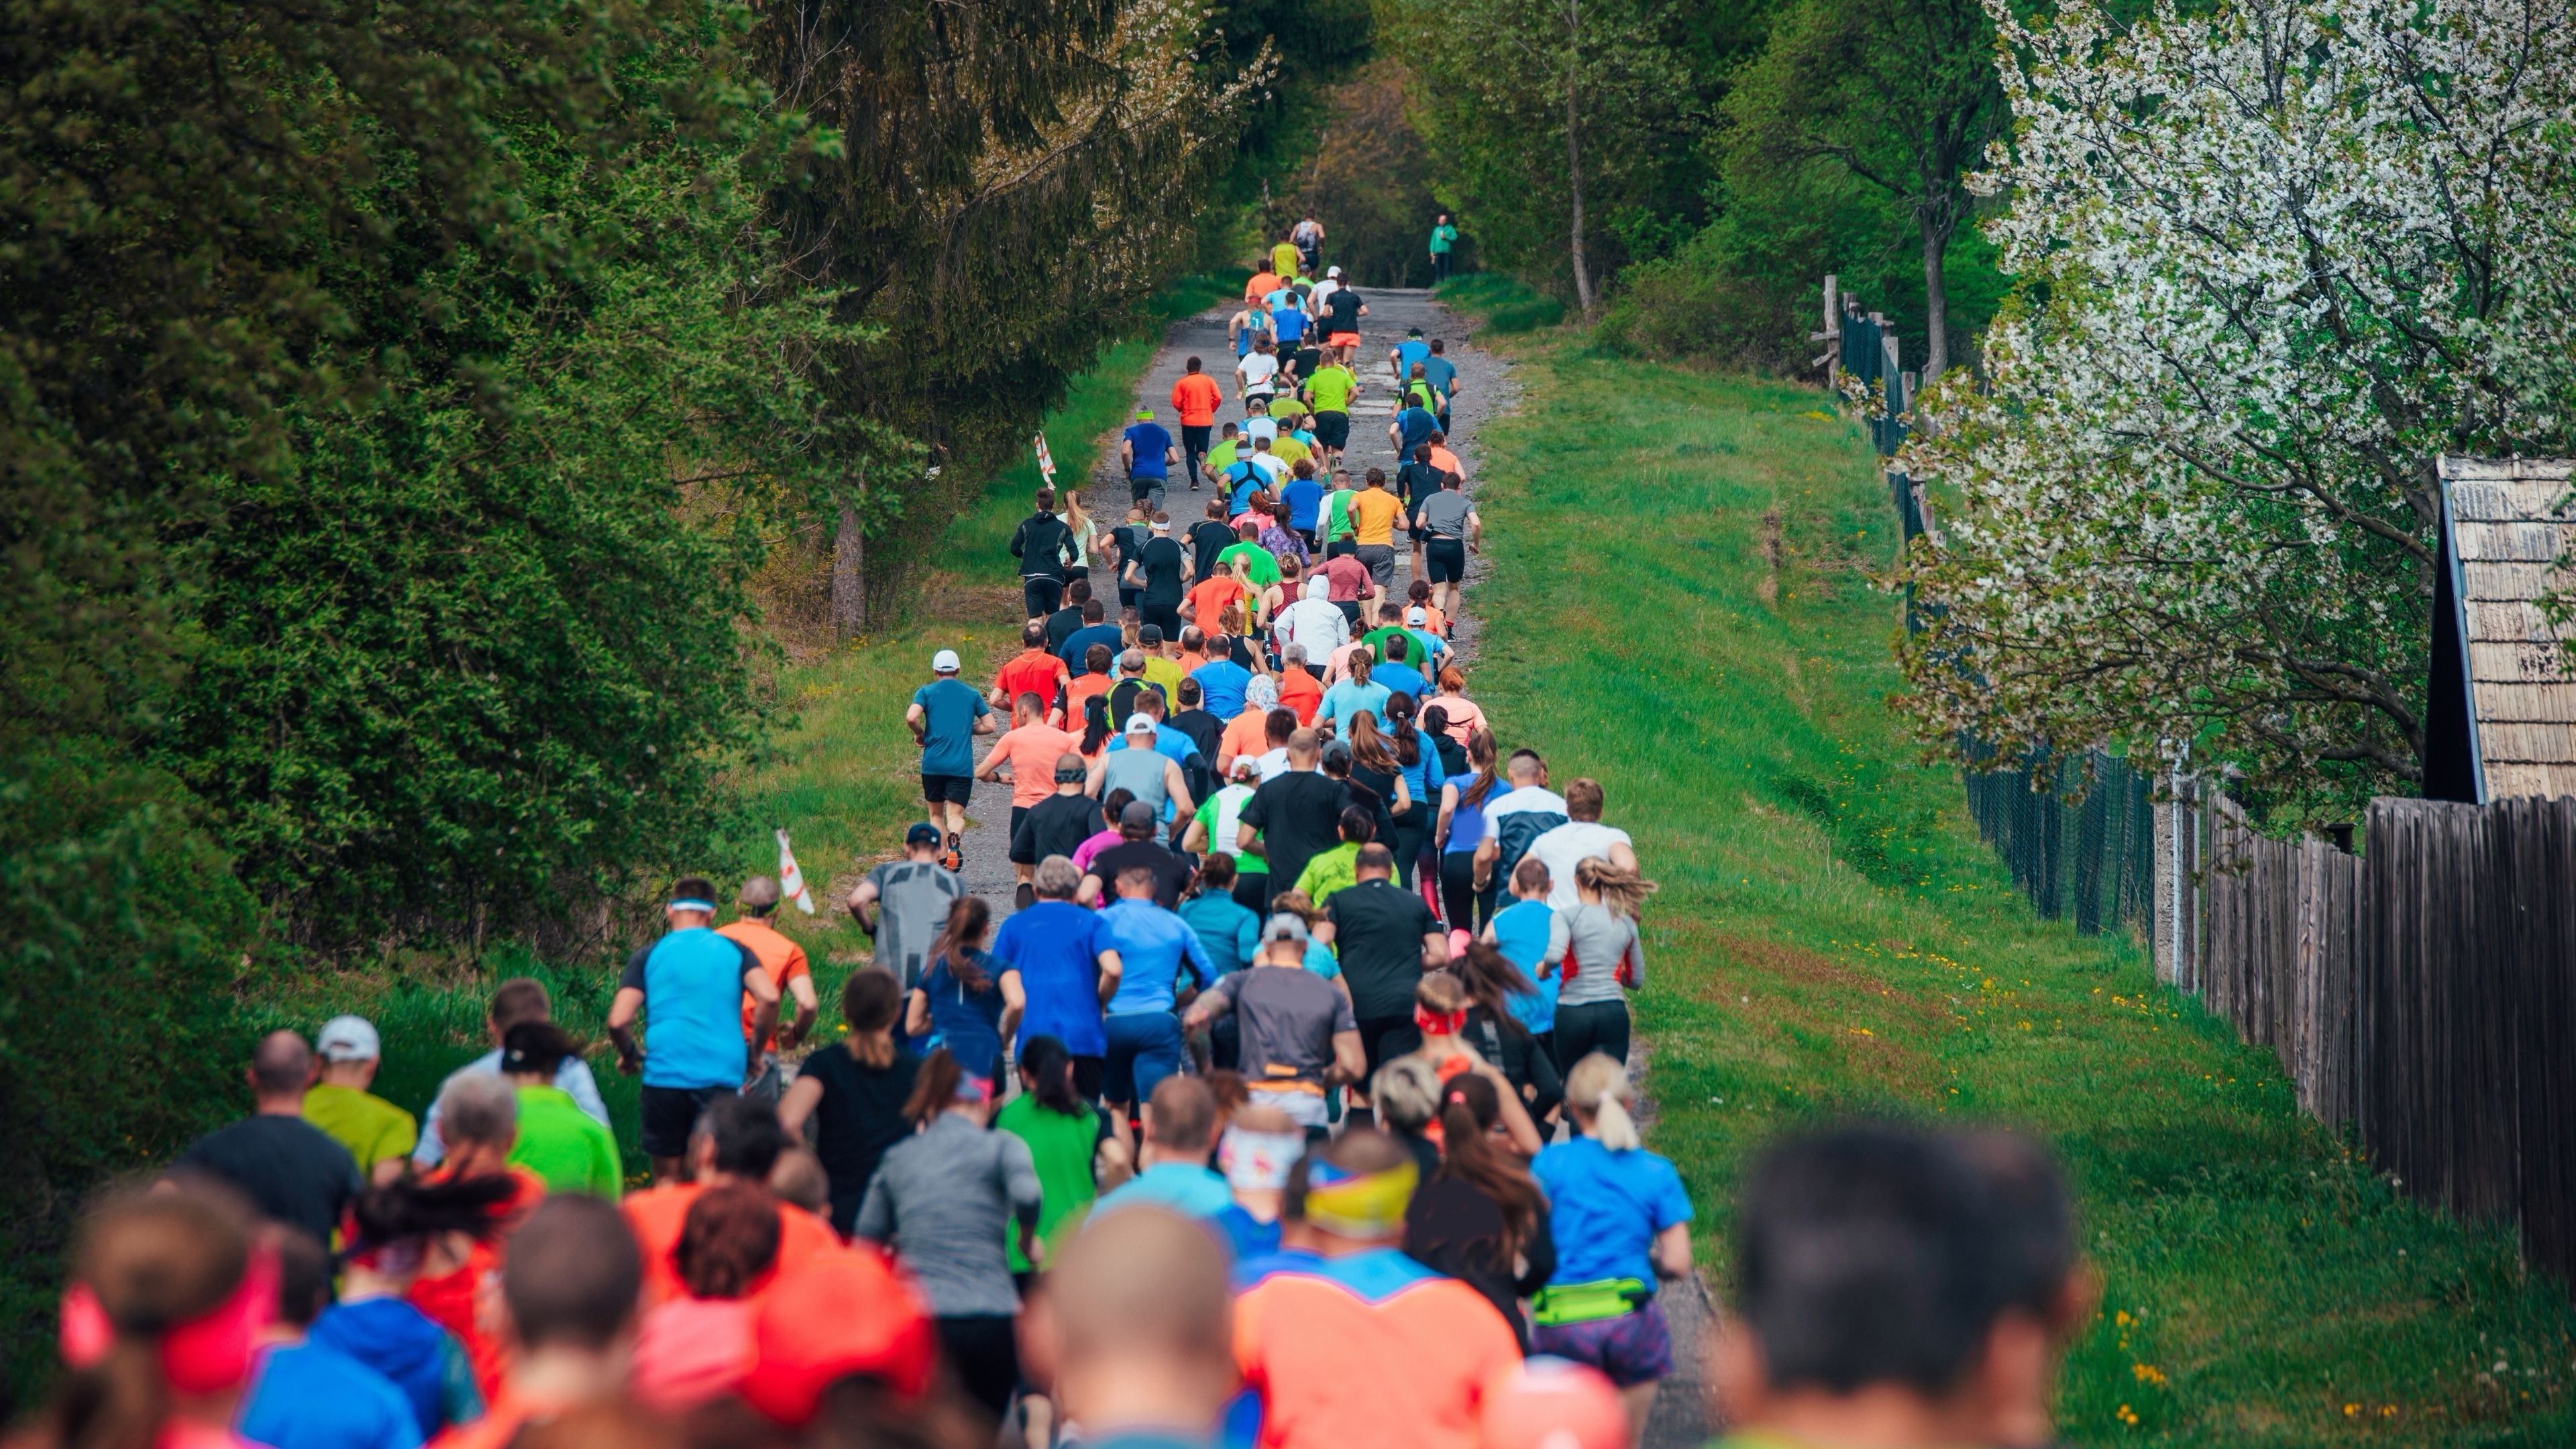
Sports competitions, such as running events, are facing increasingly strict permit requirements and safety obligations. This necessitates verifiable insight into crowd flows, bottlenecks, and environmental factors along the entire course. Centralizing monitoring provides a clear overview of crowd density, flow, and critical points.
Crowdcom acts as a single technical partner for all monitoring needs, identifying bottlenecks and measuring heat along the route to providing real-time operational guidance via interactive maps from a fully equipped command center. This ensures that safety measures are data-driven and operations remain manageable, even for large-scale sporting events.
This is what we can do for you
Real-time crowd density measurements along the route
Monitoring of crowd flows and bottlenecks
Temperature and weather monitoring for heat action plans; interactive maps via ShowTwin
Live GPS tracking of staff and emergency services
Central coordination from a fully equipped command center
Camera surveillance and CCTV support
Post-event reporting and evaluations
Support with permitting processes and safety plans
The best tools
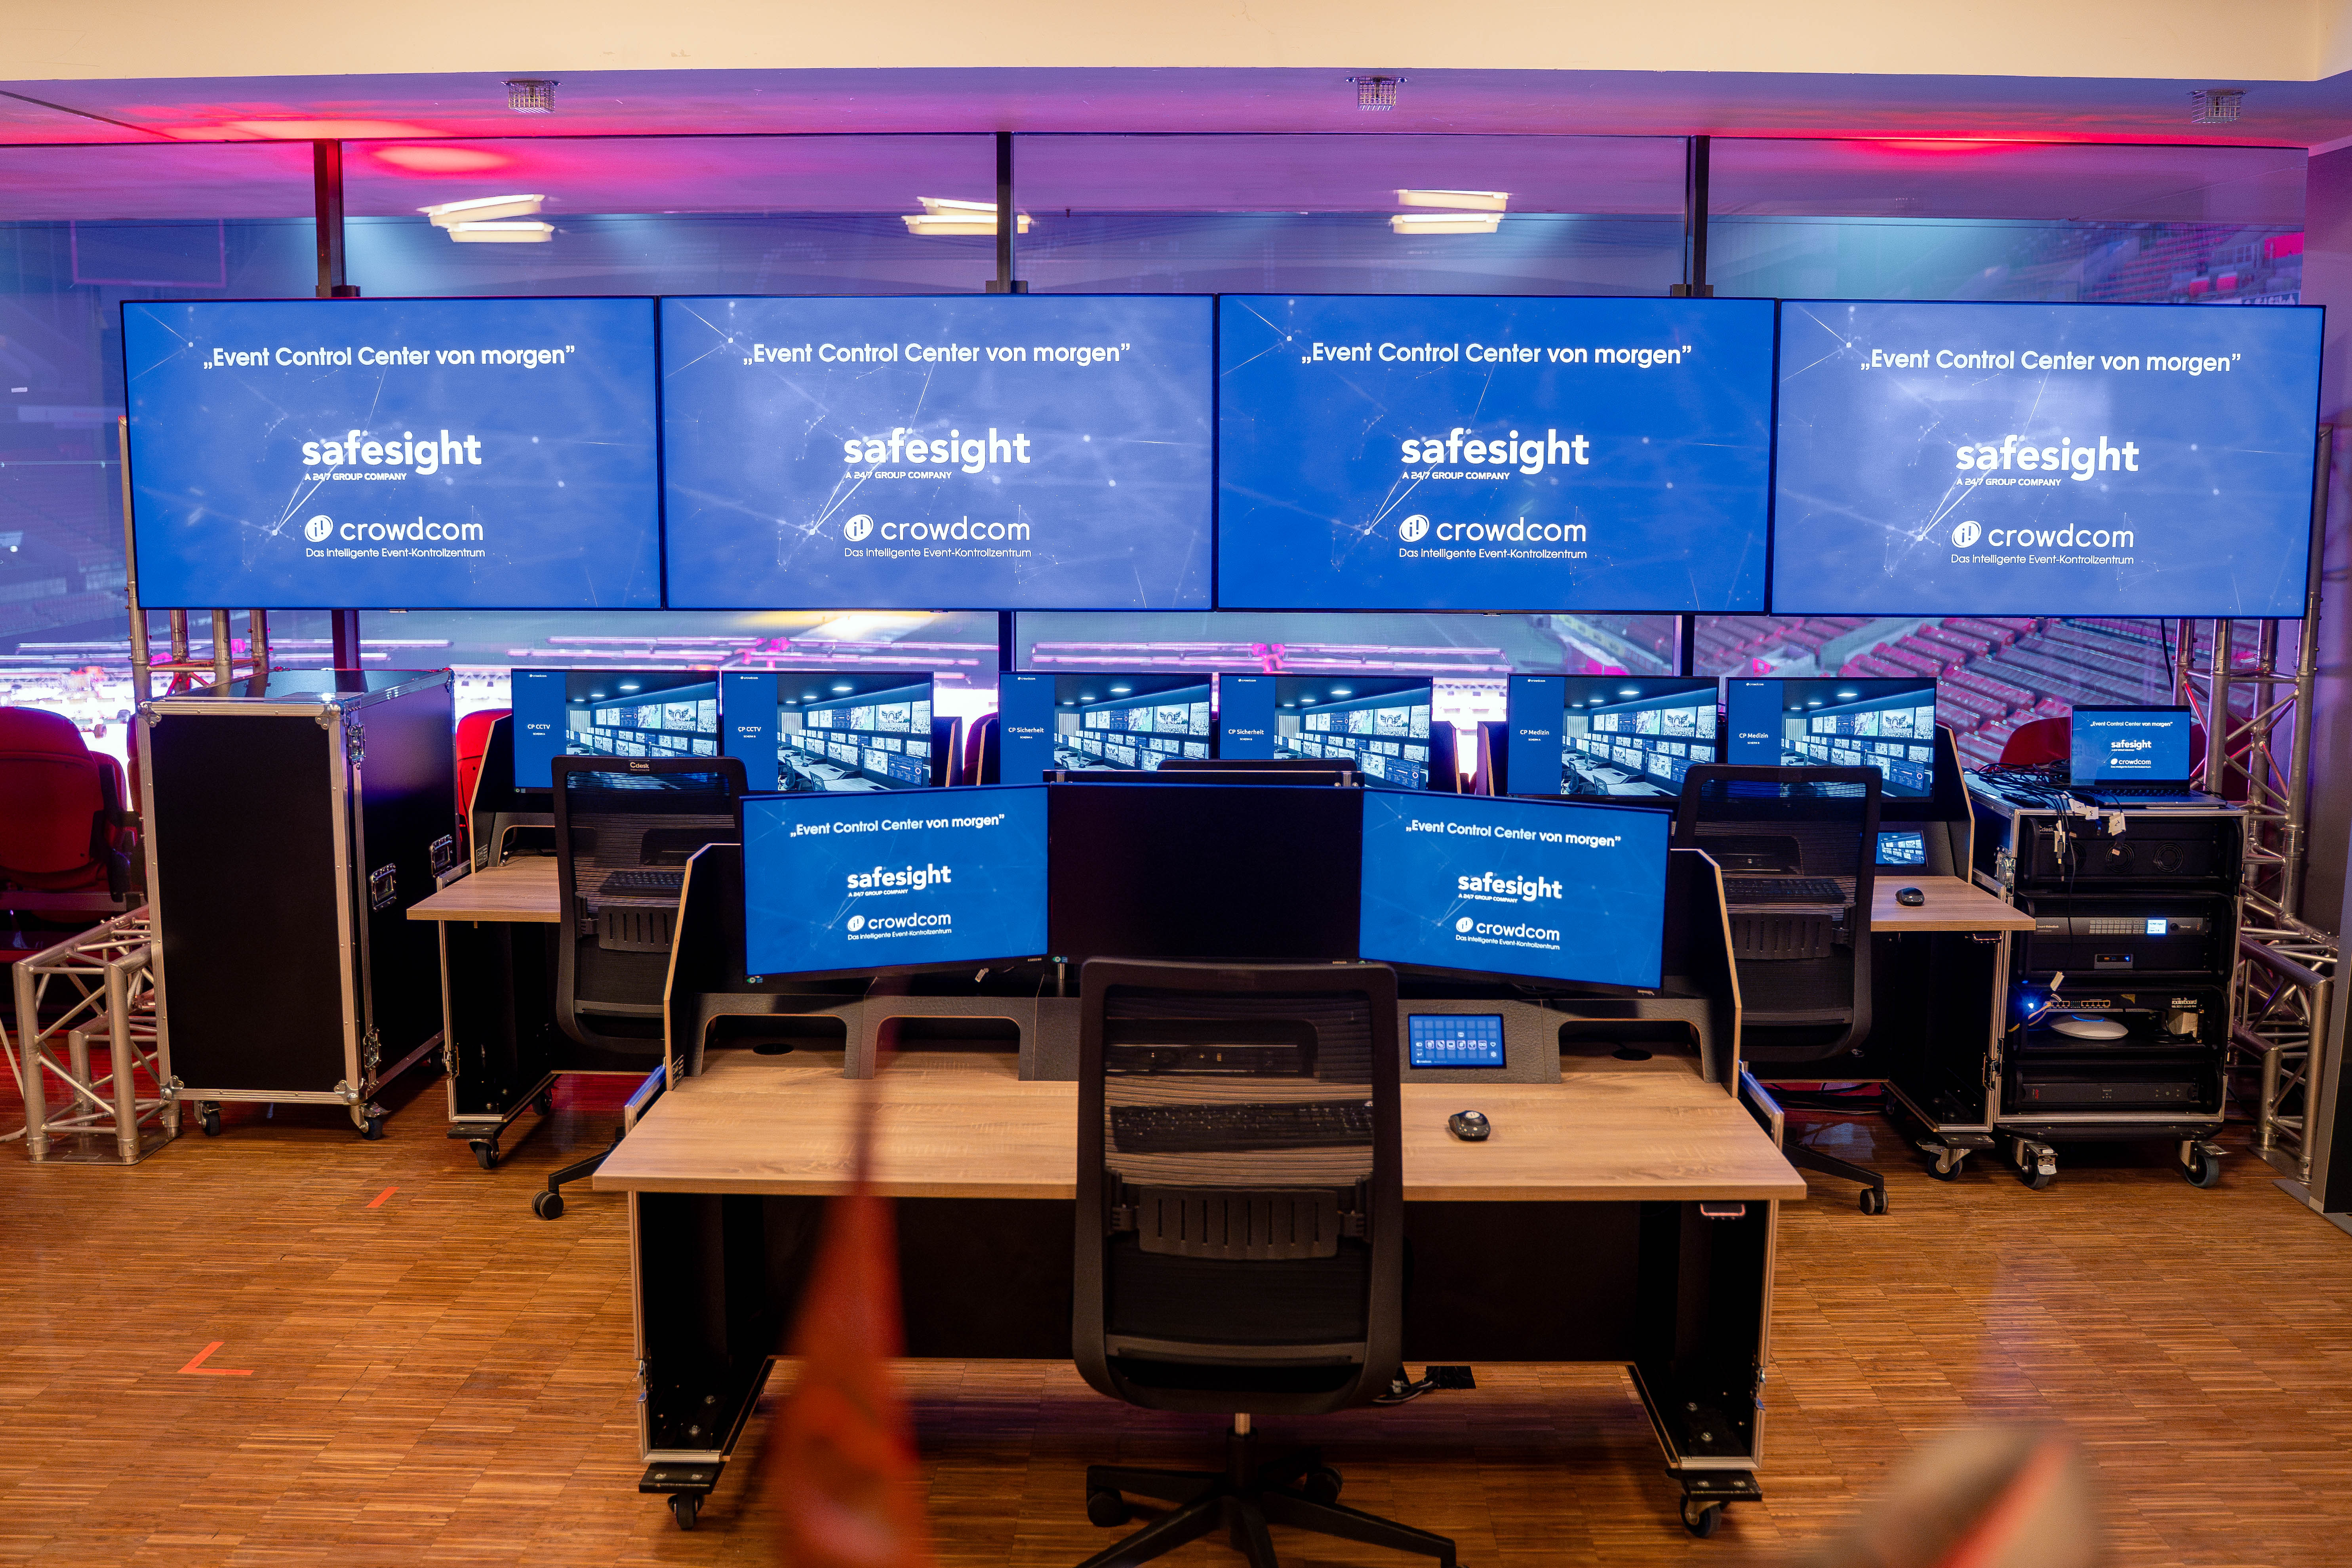
ECC small
Compact command room
.jpg)
Weather
Insight into local weather conditions

Visitor numbers
Real-time insight into visitor numbers

Data analyst
Data expertise in the central post

Event Dashboard
All data in one place
Inspiratie
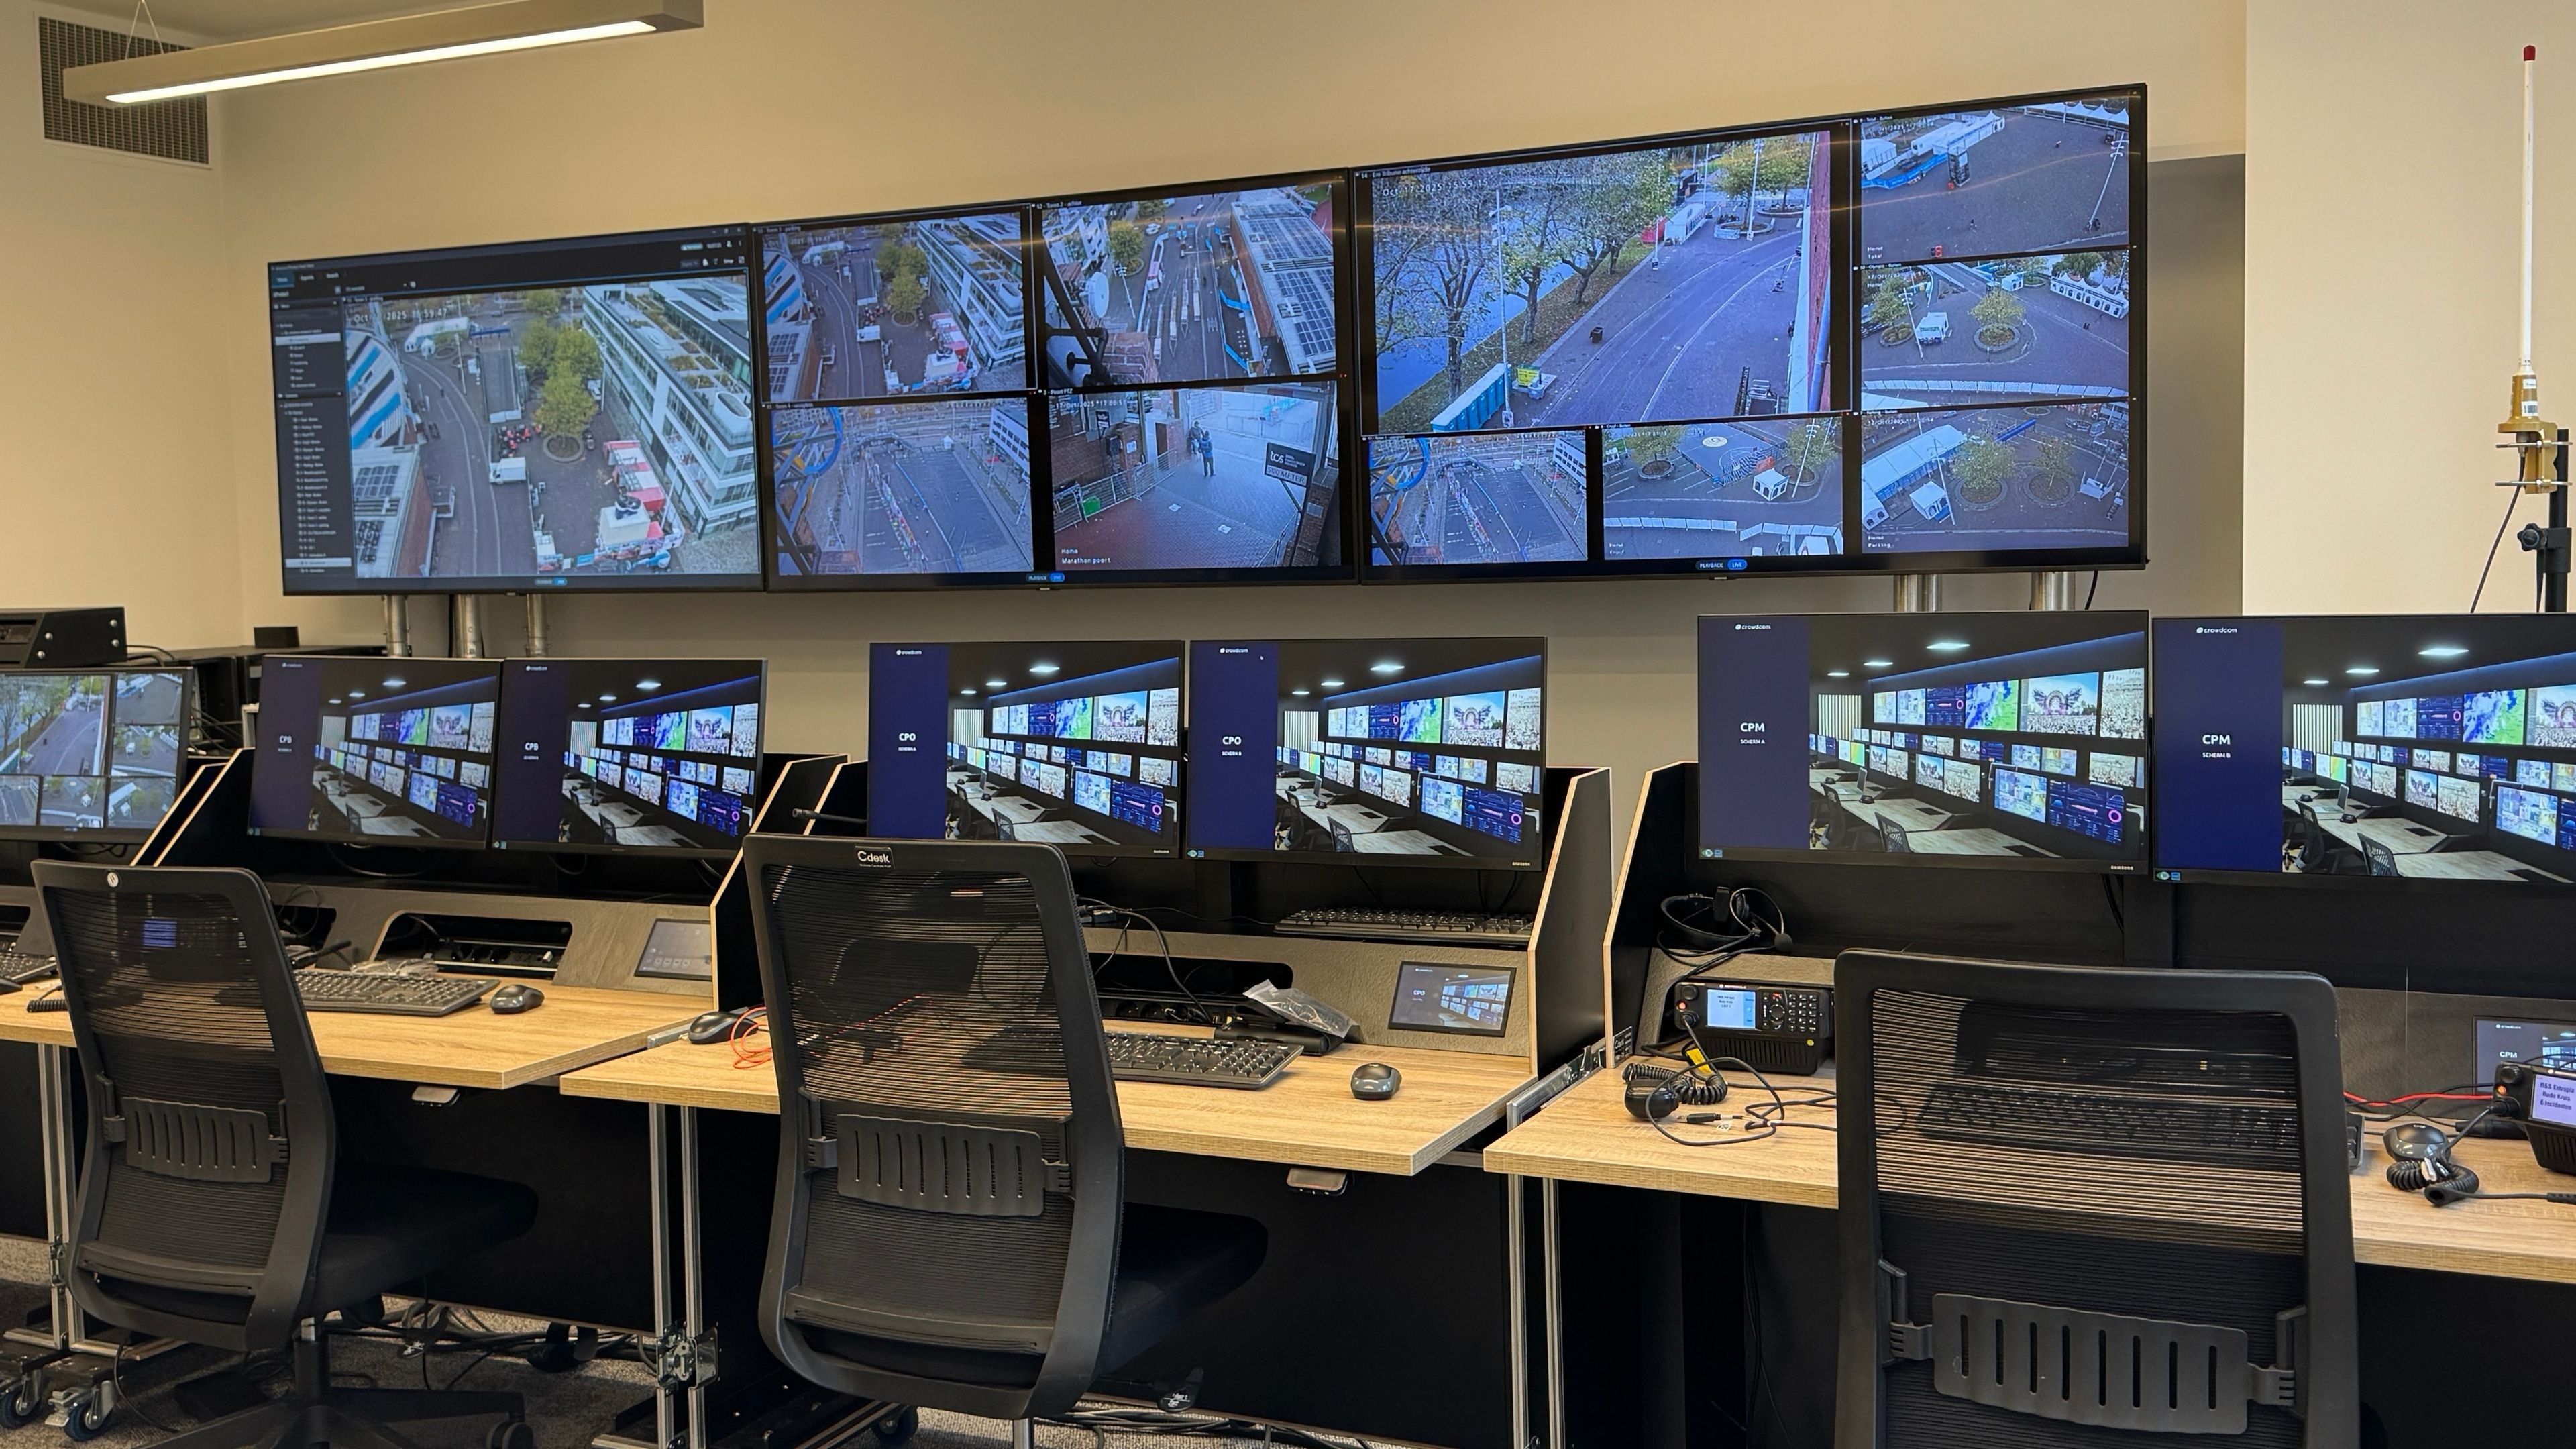
An ECC is the central hub where all information regarding an event converges. Here, organizers, security personnel, and emergency services work together based on a shared situational picture.
All data is displayed in our ShowTwin software. You can view live crowd levels on the map, visualized through colors, graphs, and measurements. Additionally, you can view the data via clear graphs and export it for further analysis.
The nearest employee can be dispatched immediately. This reduces response times.
Yes, measurements are continuously updated. Users always see the current situation.